Seasonal forecast
The Norwegian Climate Prediction Model produces a new seasonal forecast once every month.
The forecast composes of 60 climate simulations that span the likely range of seasonal outcomes. The simulations are started at the beginning of the first forecast month and integrated over a minimum of three months. Forecast anomalies are calculated relative to the 1993–2016 climatology.
Our system uses advanced data assimilation to adjust the start conditions to match today’s observed ocean state in order to produce the best possible forecast.
Note: The forecasts shown here are experimental and do not constitute an official forecast for any region or nation. They represent the most likely outcome, but other outcomes are possible and may be nearly as likely.
Select the forecast start date and the lead time to show our seasonal forecast:
Temperature
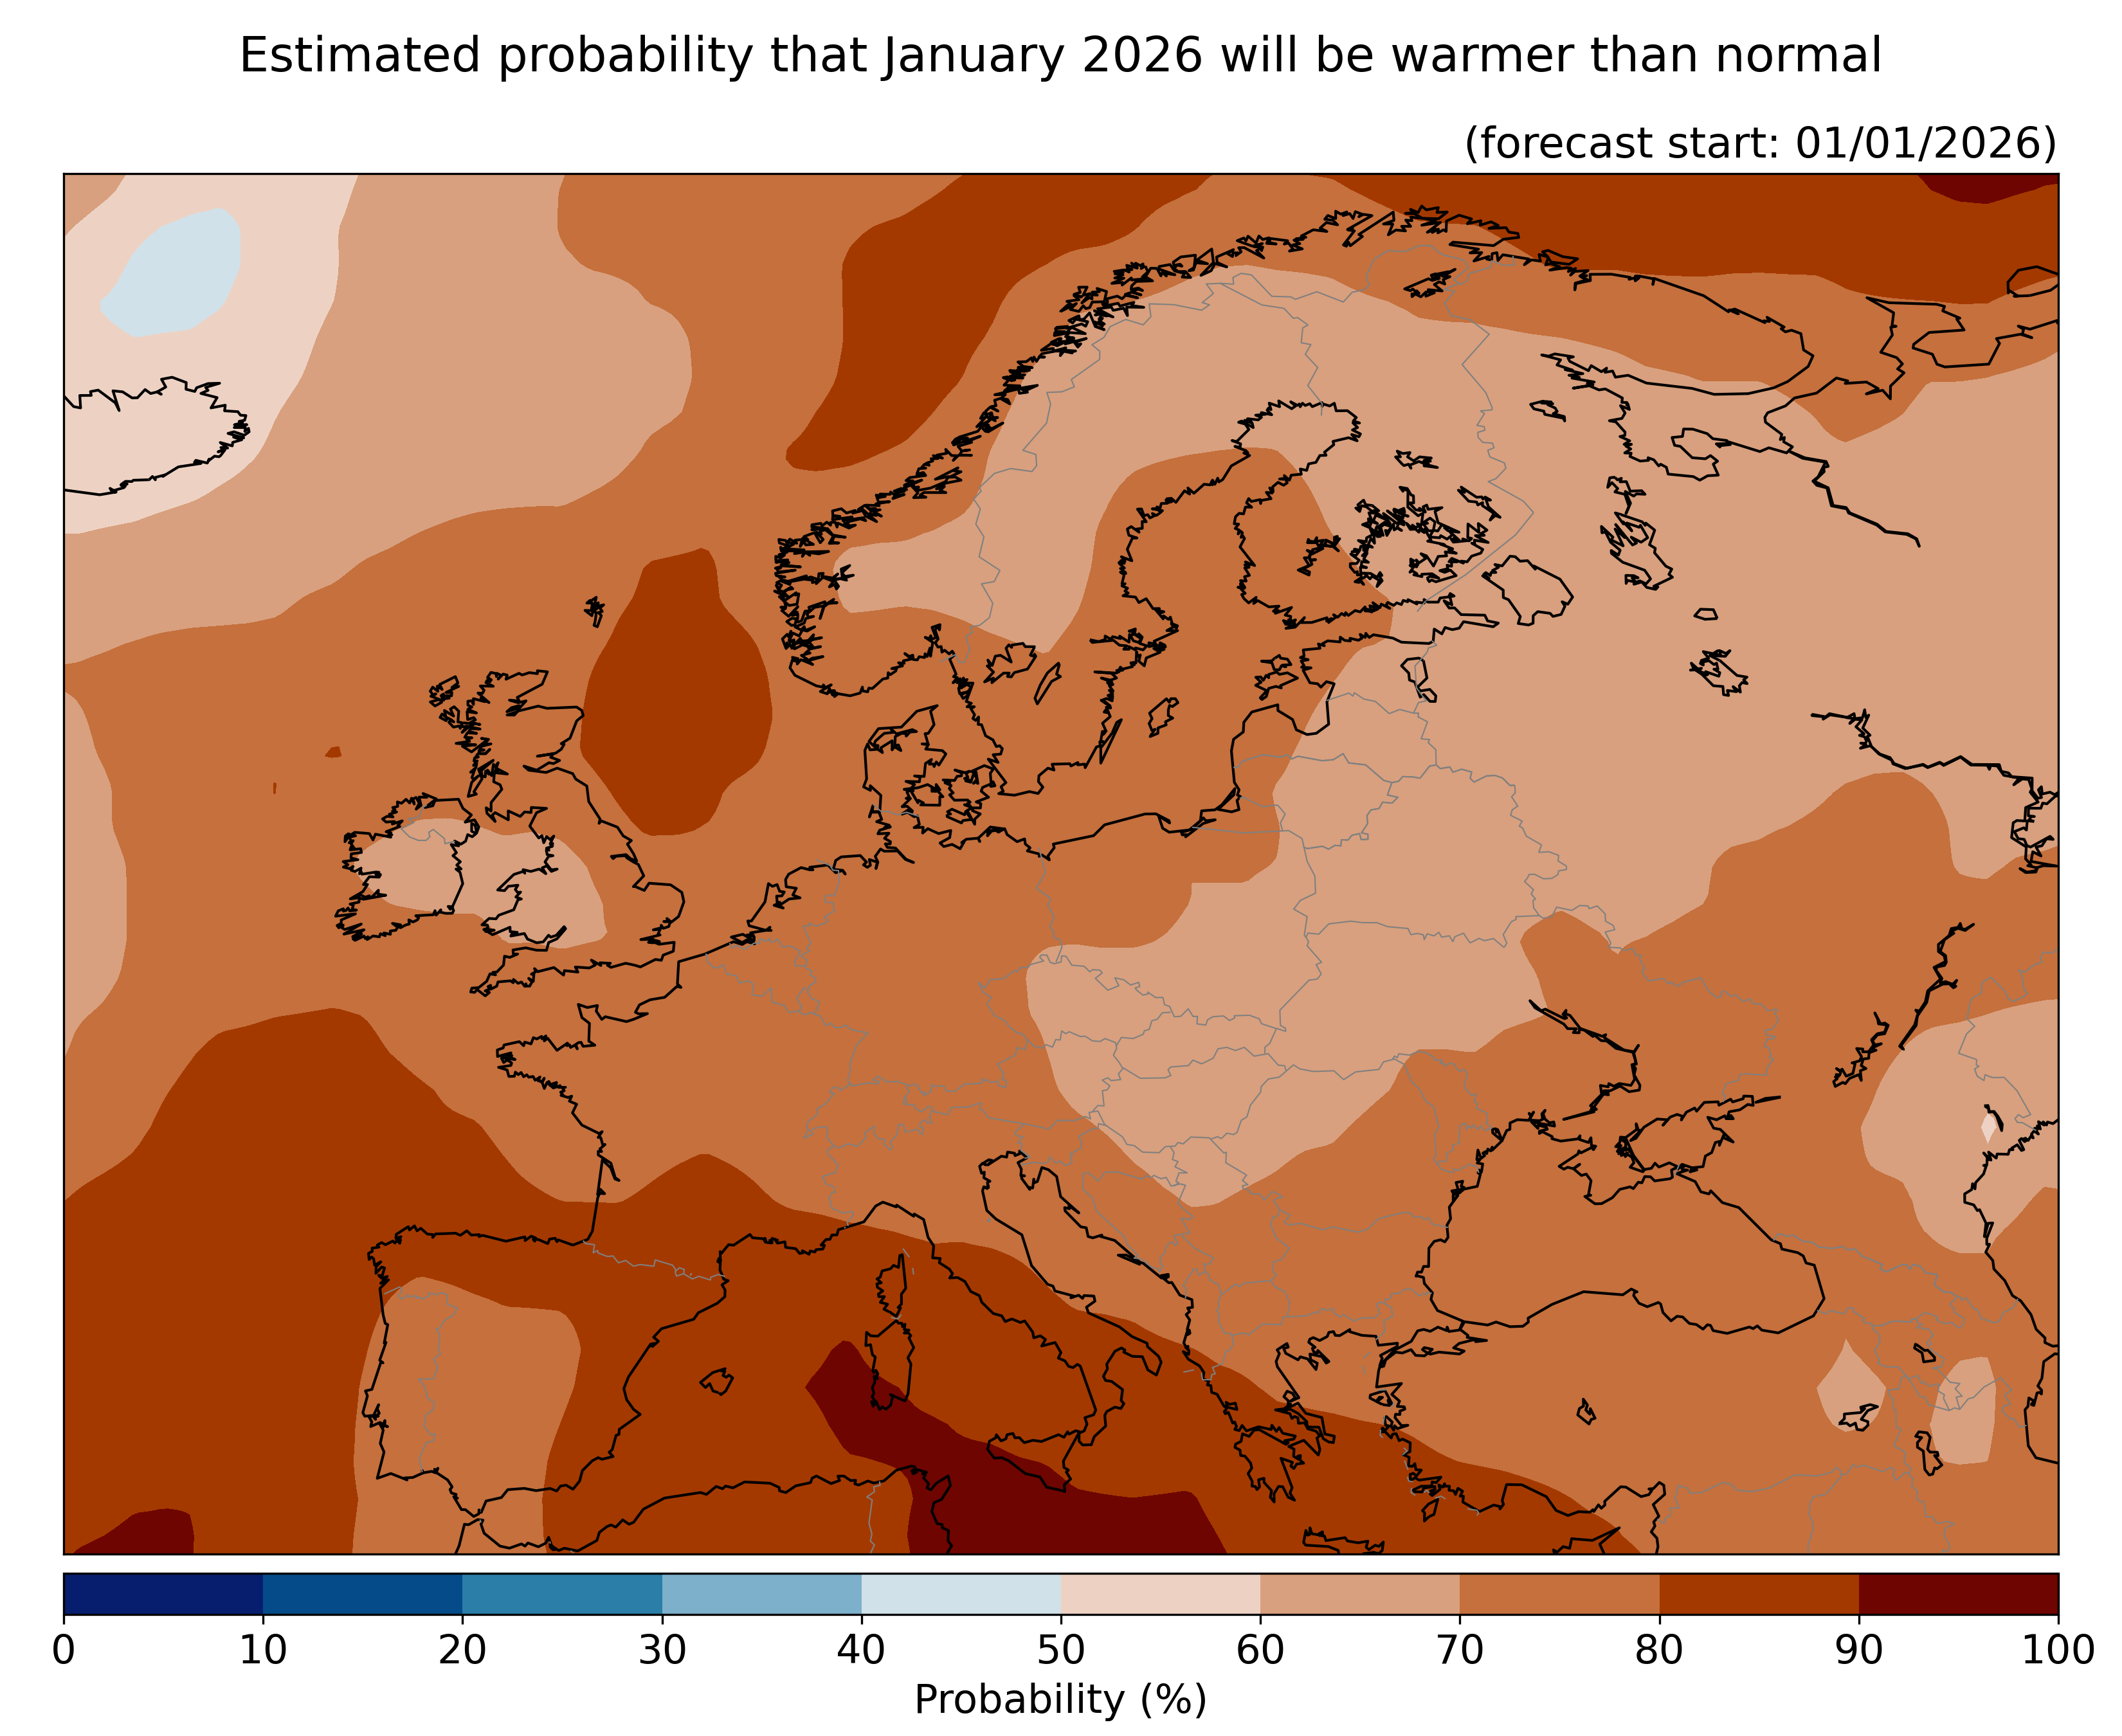
Plot below shows estimated probability that this month will be warmer than normal, relative to the 1993–2016.

Precipitation
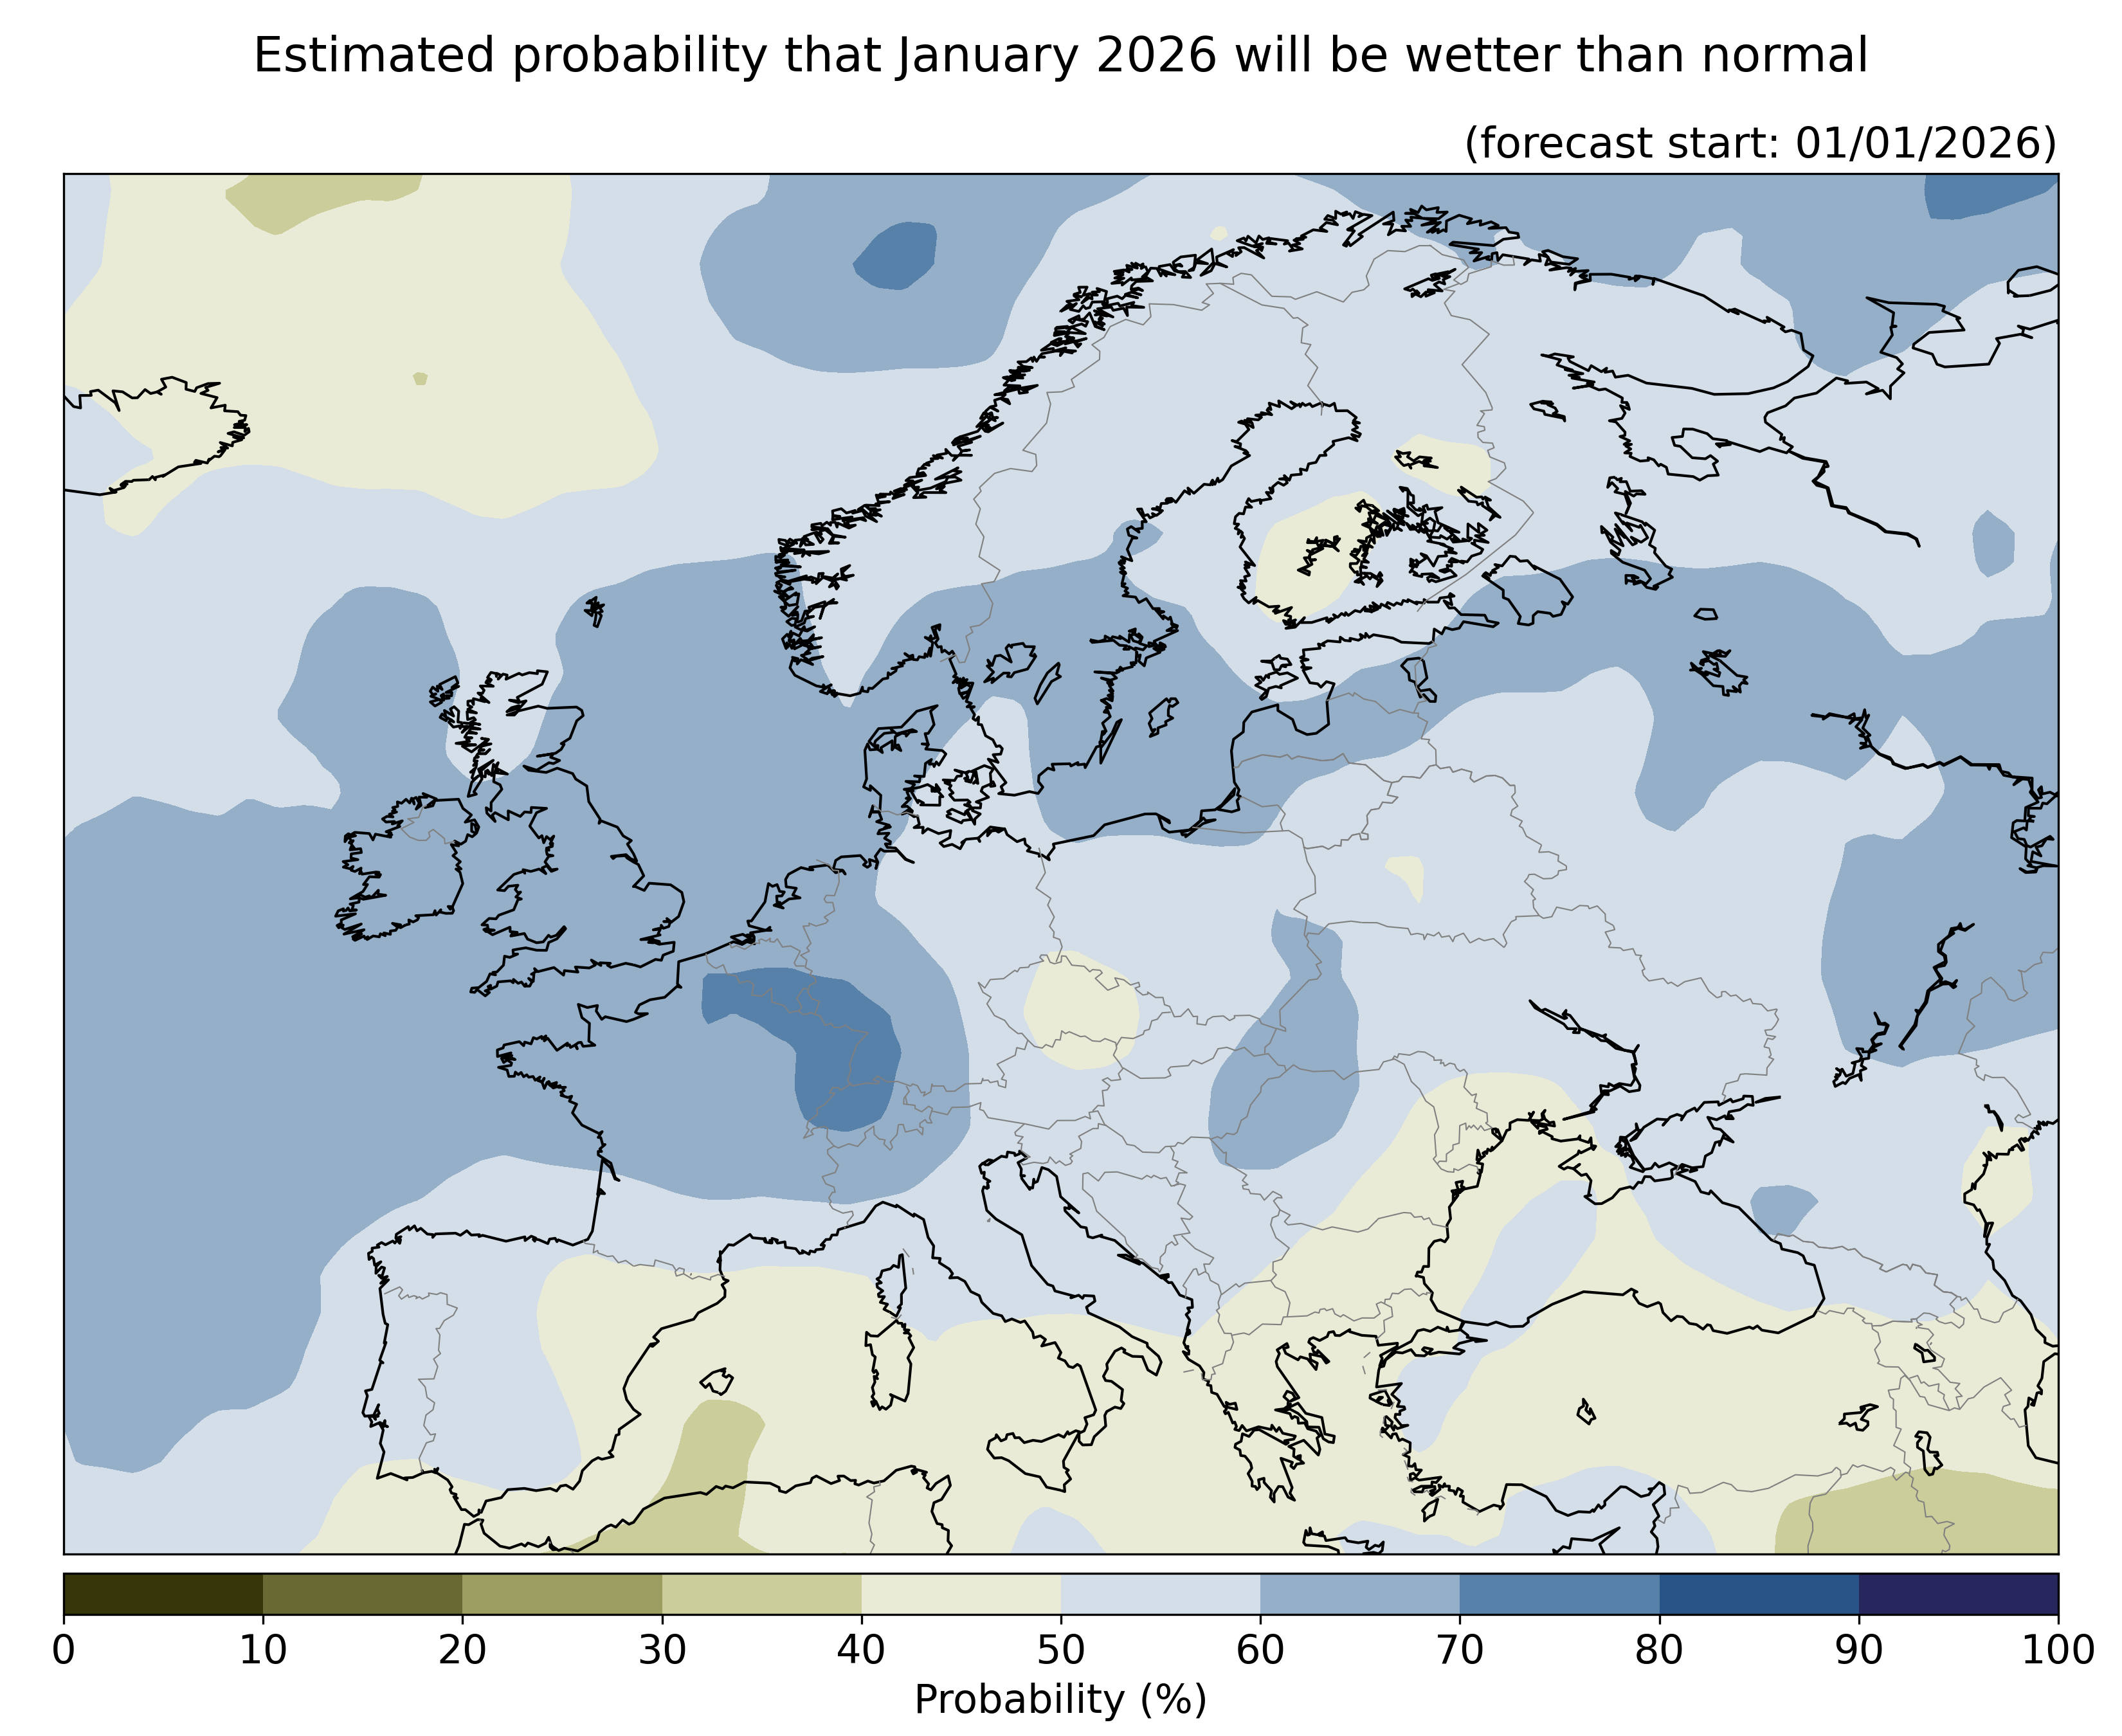
Plot below shows estimated probability that this month will be wetter than normal, relative to the 1993–2016.

Arctic sea ice area
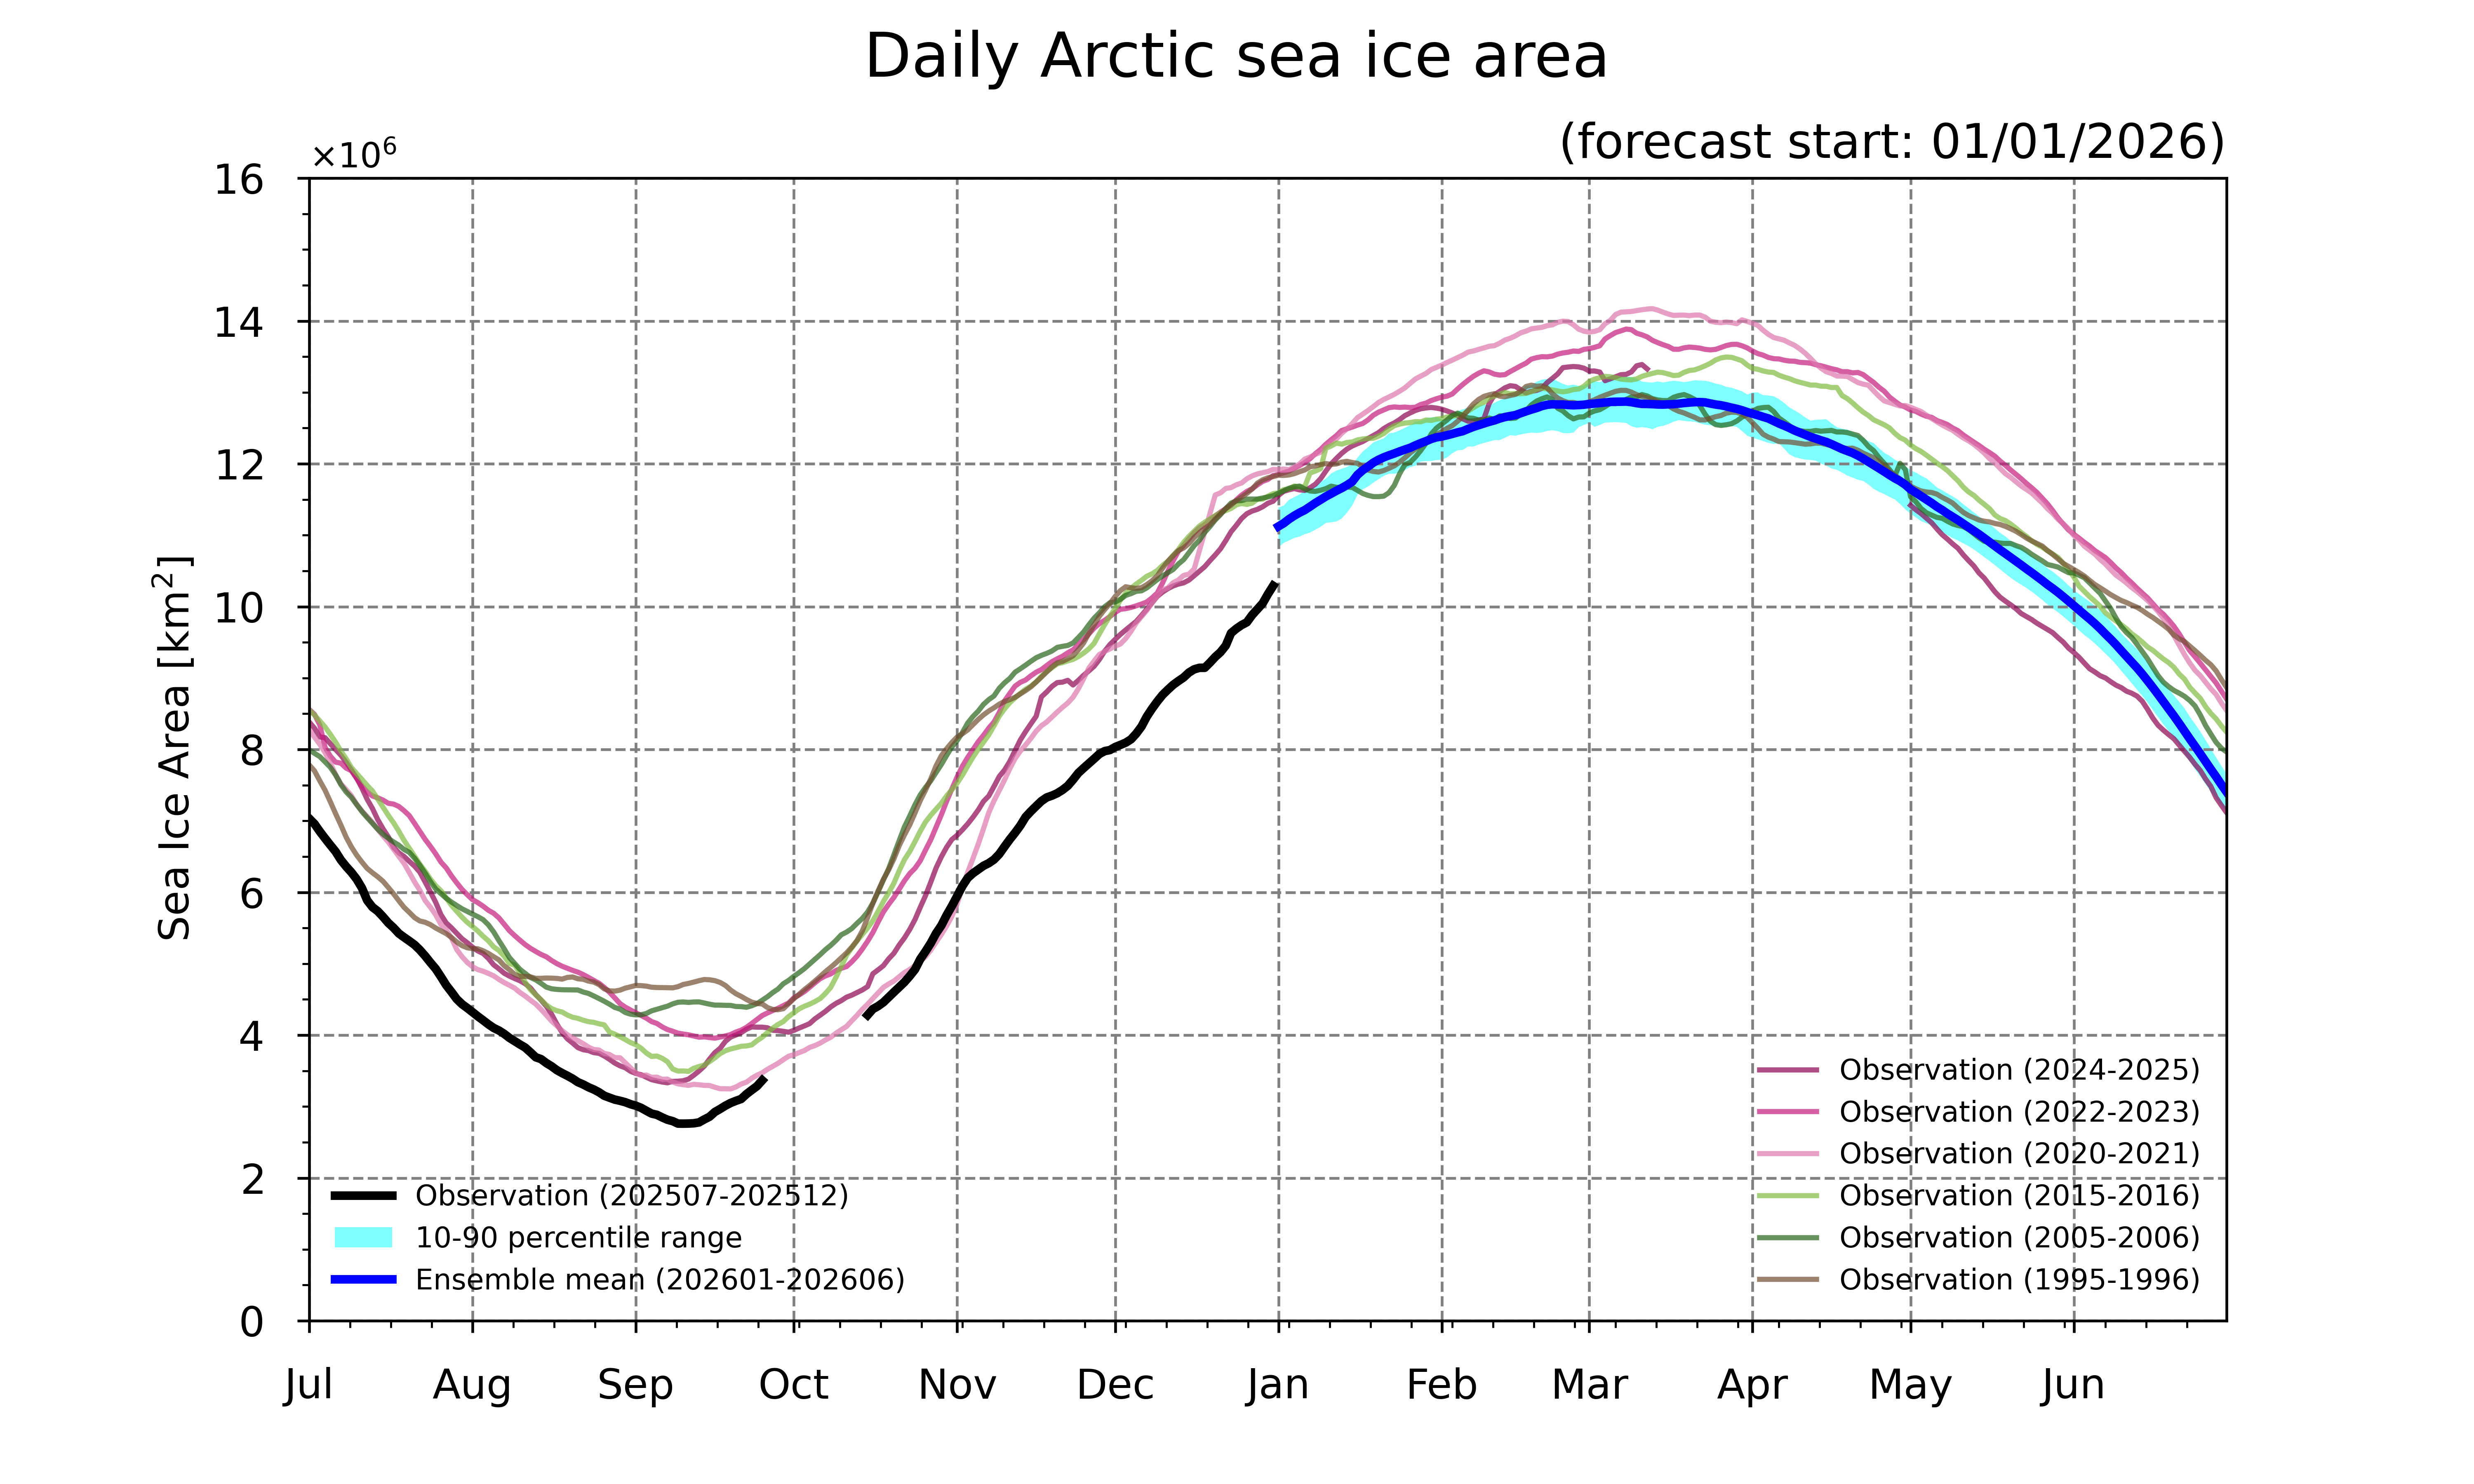
Plot below shows forecasted Arctic sea ice area for the next 6 months and observed daily Arctic sea ice area for the last 6 months. The forecasted sea ice area is calibrated by computing the climatological differences between observations and simulations, relative to the 1993-2016.

El Niño
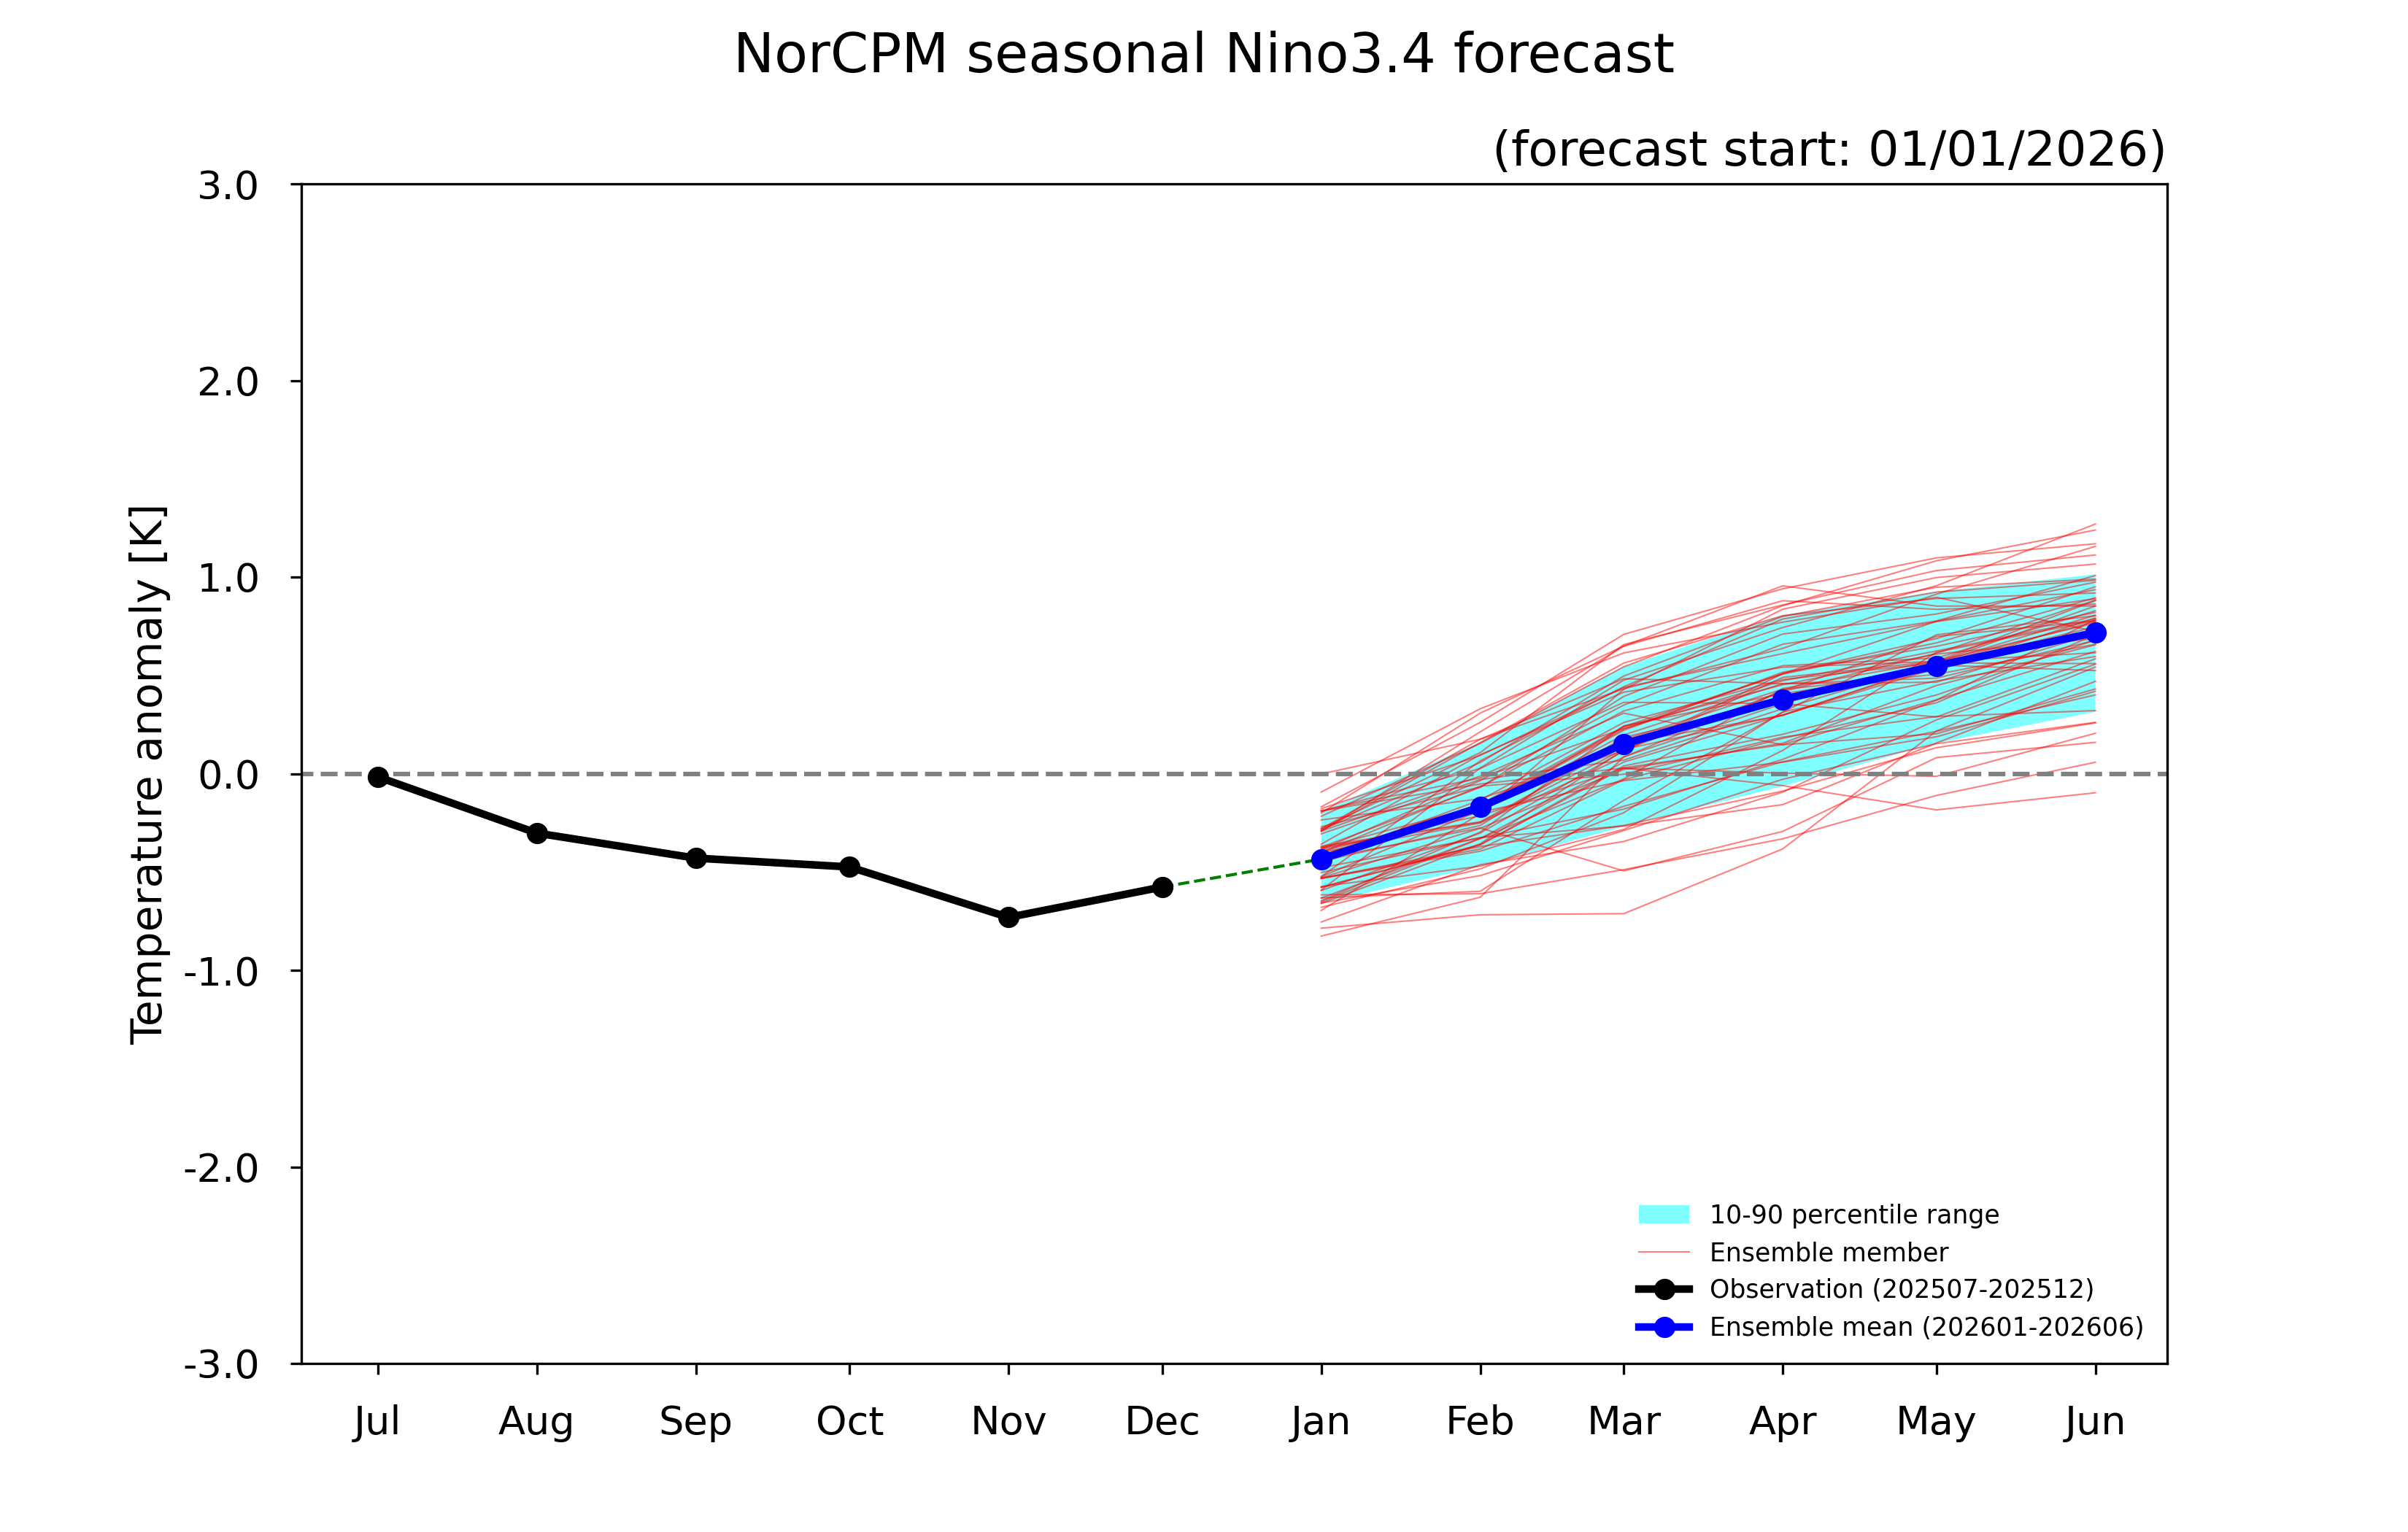
Plot below shows NINO3.4 sea surface temperature anomaly (degC). The NINO3.4 sea surface temperature anomaly is defined as the difference between the area averaged sea surface temperature from the 170°W-120°W and 5°S-5°N and the climatological reference value over same area between 1993-2016. El Nino or La Nina events are defined when the NINO3.4 SST anomalies exceed +/- 0.5°C for a period of six months.

Multi-model prediction
Multi-model seasonal forecasts provided by Copernicus Climate Change Service https://climate.copernicus.eu/seasonal-forecasts
